Hey there dear reader 😊,
I hope you are well. Today’s blog is a little bit different; it’s an analysis I did on the Stanlib Fahari I-REIT listed on the Nairobi Securities Exchange. It’s an addition to the blog series on REAL ESTATE INVESTING that I have written in the most recent blogs (you can find them on the home page, with the first real estate blog highlighting what REITs are).
Though today’s blog is heavily inclined to financial analysis, I hope you enjoy the visuals and some finance stuff of how Kenya’s only publicly listed REIT is performing.
Disclaimer; The views and analysis in this blog are meant for general information only and do not warranty or represent any form of advice concerning how you should invest. The reader is always advised to seek the advice of a registered investment advisor in all circumstances. This blog is for sharing information with each other and growing our understanding of how the finance world works.
PROPERTY ANALYSIS (Income)
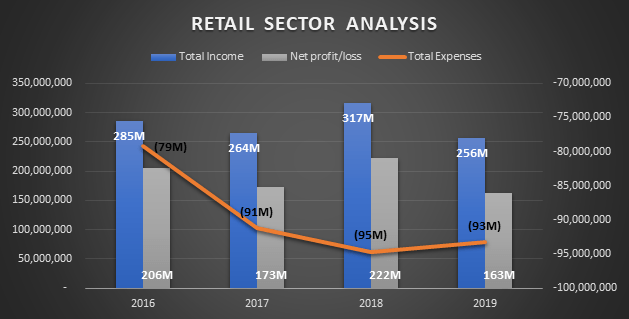
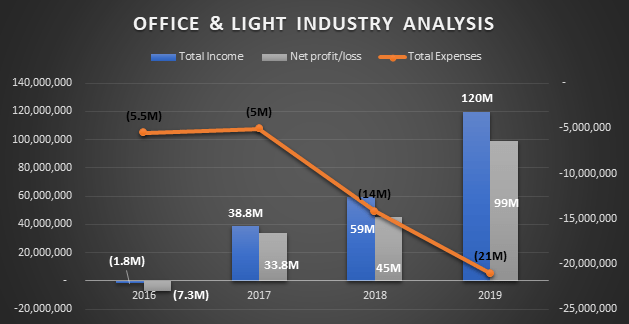
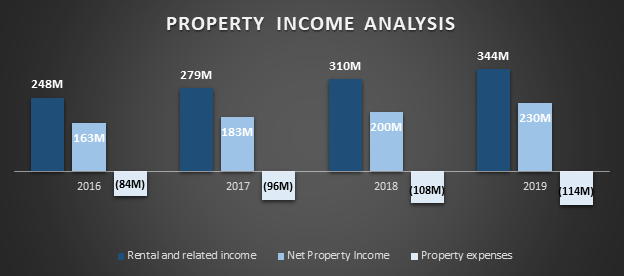
Stanlib Fahari IREIT has invested a large portion (about 75%) of its Assets Under Management (AUM) in real estate properties as mandated by the regulatory body, CMA. It then invests the remaining portion in other investment products such as bonds. A look into the income statement over the four years of reporting reveals that most of the funds’ income is generated from the retail sector which has averaged a total income of KES 281 million. Total revenue from the office and light industry has been on an upward trend.
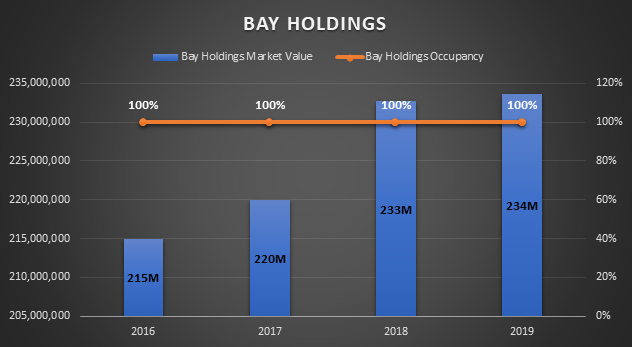
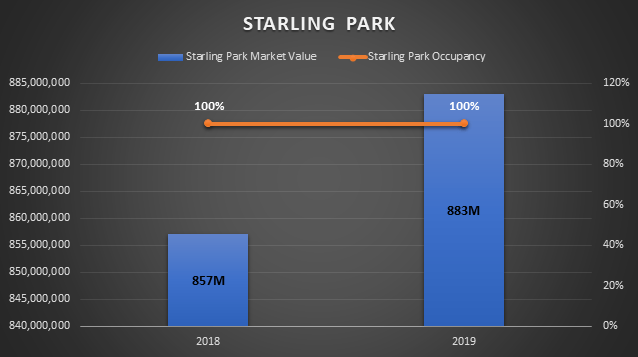
PROPERTY ANALYSIS (Occupancy and Market Value)
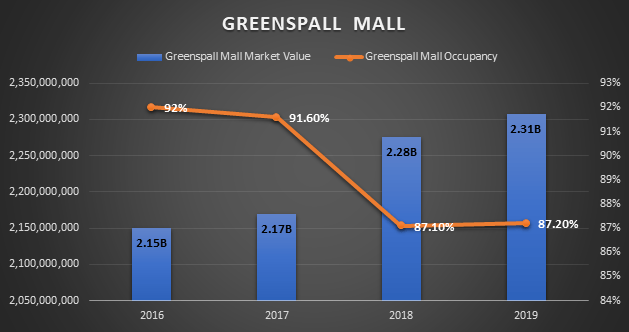
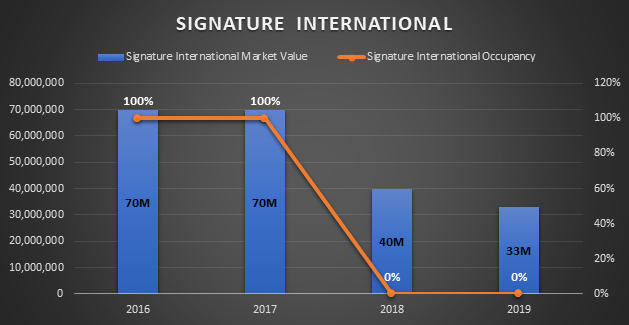
For the four properties currently under management, occupancy levels have generally been very positive; two properties (Bay Holdings and Starling Park) have had 100% occupancy since acquisition. Greenspall mall has had relatively good occupancy levels despite the decline over the four years. Signature International is currently unoccupied and has been losing value which means the firm should try dispose it to avoid further losses from this property.
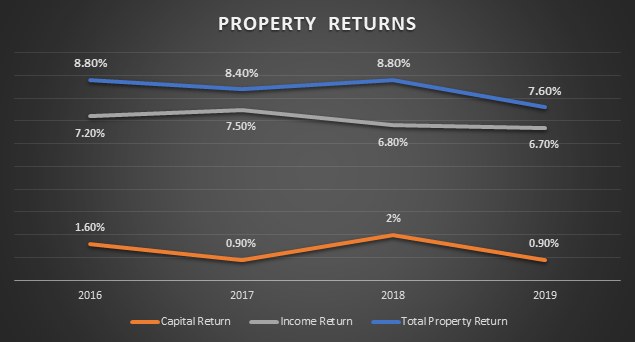
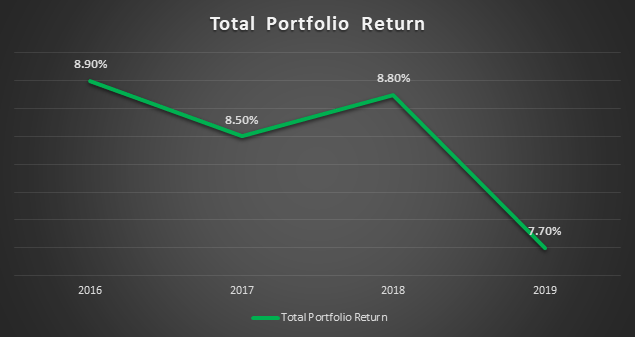
PROPERTY RETURNS
Stanlib Fahari I-REIT has had positive property returns from rent and capital appreciation which have averaged at 8.4%. Total portfolio returns which includes properties and investment products has also been performing well at an average of 8.5%.
FINANCIAL STATEMENTS ANALYSIS
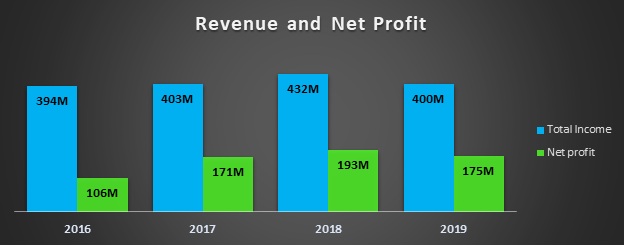
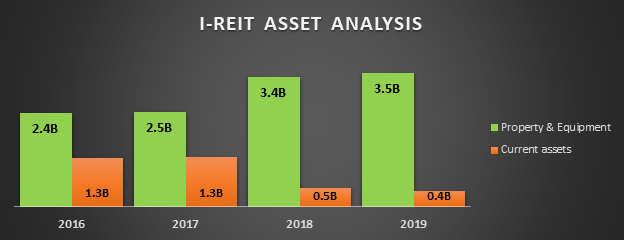
The I-REIT has proved to be a profitable company in the four years of analysis; this is evident from a four-year average net profit of KES 161 Million. As expected, the firm has most of its net assets as property and equipment. Healthy and stable net profits have also been witnessed from the property income.
DISTRIBUTIONS
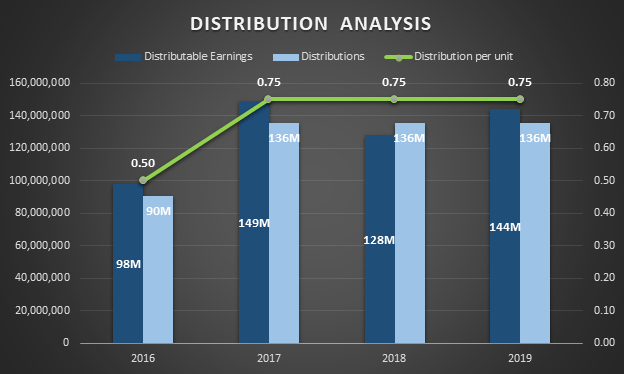
Stanlib Fahari I-REIT has maintained a unitholder distribution of KES 0.75 over the past three years. However, given the reduced economic activity due to the pandemic, it is expected that this distribution will remain the same next year and maybe grow in the year 2022 afterwards.
| Details | 2016 | 2017 | 2018 | 2019 |
| DISTRIBUTIONS | ||||
| Dividends from wholly owned prop. Companies | 190,597,729 | 184,894,243 | 201,460,125 | 230,724,761 |
| Interest Income | 111,209,231 | 99,852,345 | 56,646,680 | 24,611,177 |
| 301,806,960 | 284,746,588 | 258,106,805 | 255,335,938 | |
| LESS | ||||
| Fund operating expenses | (180,422,344) | (135,632,948) | (130,221,511) | (111,301,743) |
| Interest paid | (23,374,328) | 0 | 0 | 0 |
| Total potential distributable income (FFO) | 98,010,288 | 149,113,640 | 127,885,294 | 144,034,195 |
| Distributions | 90,486,150 | 135,729,225 | 135,729,225 | 135,729,225 |
| Distribution as a % of distributable Income | 92.32% | 91.02% | 106.13% | 94.23% |
FREE CASH FLOW ANALYSIS
In terms of free cash flow (FCF) available to the firm after netting capital expenditure and distributions paid, the company appears to have insufficient cash to be able to fund its expenses in the future. However, it is worth noting that the negative FCFs are as result of heavy investment in infrastructure real estate projects. Thus, despite the undesirable cash flows, we can expect positive cash flows possibly in the years 2022 afterwards, as businesses resume operations especially in the retail industry.
| Details | 2016 | 2017 | 2018 | 2019 |
| Operating CF/Net Sales | 24.72% | 50.77% | 39.08% | 32.59% |
| Net cash (outflow)/inflow from operating activities | 83,438,364 | 137,441,215 | 129,843,795 | 115,335,771 |
| Distribution paid | 0 | (90,486,150) | (135,729,225) | (135,729,225) |
| Net cash (outflow)/inflow from investing activities | 3,151,452,661 | 201,048,503 | 379,482,068 | 186,366,123 |
| FCF | (3,068,014,297) | 248,003,568 | (385,367,498) | (206,759,577) |
VALUATION
The dividend discount model (DDM) was used to determine the intrinsic value of the I-REIT share. The following assumptions were made
- Calculated Ke = 19%…given that they have 100% Equity and 0% Debt. [Ke = D1/MPS *100]
- TV = Terminal value
- TV (r-g) = 14%…assuming g = 5% ‘infinite growth rate’.
- Dividend growth rate = 10.67% [g = nSQRT (Latest dividend/Earliest dividend) – 1]
| Dividend Discount Model | 2020 | 2021 | 2022 | 2023 | 2024 | 2025 (TV) TVg=5% | TV |
| DIV growth | 0.83 | 0.92 | 1.02 | 1.13 | 1.25 | 1.31 | 9.34 |
| Disc. Rate | 1.19 | 1.42 | 1.69 | 2.01 | 2.39 | 2.84 | |
| Intrinsic Value (IV) | 0.70 | 0.65 | 0.60 | 0.56 | 0.52 | 3.29 | |
| IV | 6.32 |
Given the current retailing price range of about KES 5.30, the Stanlib Fahari IREIT (FAHR) is currently undervalued.
FINANCIAL RATIOS
| Details | 2016 | 2017 | 2018 | 2019 |
| Trade and other receivables | 102,059,051 | 80,298,716 | 55,148,773 | 71,245,082 |
| Trade and other payables | 124,435,477 | 95,446,371 | 128,677,648 | 115,006,176 |
| Details | 2016 | 2017 | 2018 | 2019 |
| Operating Margin | 38.32% | 63.22% | 58.24% | 49.52% |
| Profit Margin | 31.40% | 63.22% | 58.24% | 49.52% |
| Details | 2016 | 2017 | 2018 | 2019 |
| Outstanding shares | 180,972,300 | 180,972,300 | 180,972,300 | 180,972,300 |
| EPS | 0.59 | 0.95 | 1.07 | 0.97 |
| ROE | 2.96% | 4.67% | 5.20% | 4.66% |
| Details | 2016 | 2017 | 2018 | 2019 |
| Non-Current Assets | 2,439,729,976 | 2,464,138,729 | 3,370,840,466 | 3,472,215,047 |
| Fixed Asset Turnover | 0.14 | 0.11 | 0.10 | 0.10 |
| Total Assets | 3,715,011,411 | 3,761,627,663 | 3,852,621,474 | 3,878,449,025 |
| ROA | 2.85% | 4.55% | 5.02% | 4.52% |
| Total Value of Equity (BS) | 3,585,541,033 | 3,666,181,292 | 3,723,943,826 | 3,763,442,849 |
